

You may not be too surprised to hear that some intersections in Arlington are a lot more dangerous than others. These crossroads are familiar problem spots for accidents involving motorists, bicyclists, and pedestrians. Many of these dangerous intersections are along the county’s busiest corridors. This includes Richmond Highway, Arlington Boulevard, and Langston Boulevard.
The majority of accidents in these areas are attributed to large volumes of traffic, cars turning onto or off the road, limited sight distances, and improper pedestrian crossings.
The following intersections had the most police-reported crashes in 2023. The information is presented by Arlington’s Vision Zero and compiled in the 2023 Annual Crash Report. The types of crashes vary from rear-end and angle to pedestrian and sideswipe crashes.

Our goal is to help readers to be more aware of where these dangerous intersections are. You may want to reduce your speed, be more observant, and watch out for dangerous maneuvers when approaching these intersections. For commuters who drive through Arlington, vigilance at these locations could reduce the likelihood of a crash.
What Are the 60 Most Dangerous Intersections in Arlington?
Here are the 10 most dangerous intersections in Arlington, based on Vision Zero and 2023 crash data:
- Richmond Hwy & 23rd St S – 18 crashes in 2023
- S Hayes St & Army Navy Dr – 17 crashes
- Langston Blvd & Spout Run Pkwy – 12 crashes
- Arlington Blvd & Fillmore St – 12 crashes
- Arlington Blvd & Irving St – 11 crashes
- George Mason Dr & S Four Mile Run Dr – 11 crashes
- S Walter Reed Dr & S Courthouse Rd – 10 crashes
- Glebe Rd & Pershing Dr – 9 crashes
- 14th St N & N Meade St – 8 crashes
- Langston Blvd EB & Lynn St – 8 crashes
What Does the VisionZero 2023 Crash Report Reveal?

The following data comes from Arlington’s 2023 Annual Crash Report.
Arlington had 2,076 police-reported traffic crashes in 2023. That is more than five a day. Six crashes were fatal. Five of the fatal crashes involved alcohol, and two were on interstates. Severe crashes represented 3 percent of the reported incidents.
There were 109 pedestrian crashes. One crash was fatal and 17 were serious. Fourteen pedestrian crashes involved alcohol. There were 52 bicycle crashes. Three of them were serious injuries, but there were no fatalities. All bicyclists had helmets on.
Speed was a factor in 476 of the collisions. Distraction in 373, and alcohol in 192. About one-third of all the collisions happened at night. Many happened on the High Injury Network and in equity-targeted areas.
Other trends were crash peaks during afternoons, crash peaks due to rain, and high incident rates with elderly drivers, young drivers, and intersections.
How Are Accidents in Arlington Categorized?
The Virginia Police Crash Report classifies crash severity on the basis of the most severe injury resulting from the crash. In cases involving more than one individual, the report employs the most severe degree of injury to determine the crash severity.
Crash Severity Categories & Definitions
- Fatal
- Serious Injury
- Minor/Possible Injury
- No Apparent Injury
- No Injury
Any crash that results in a fatality, either at the scene or following post-crash medical care, is considered Fatal.
Serious Injury accidents are those which are defined by certain conditions, including severe lacerations with exposed tissue, fractured bones, crush injuries, and internal injuries like chest or skull fractures. It also includes second- or third-degree burns covering most of the body’s surface area, loss of consciousness, or paralysis due to the accident.
Minor/Possible Injury incidents are less severe, but damage is apparent, such as bruising or swelling.
An example of a No Apparent Injury scenario is when a person who complains of pain or loss of consciousness temporarily but with no obvious sign of injury.
When it’s a No Injury crash, the accident is counted as a property-damage accident and left to the insurance companies to deal with.
How Are the Different Types of Crashes Defined?

Virginia law enforcement use several categories to describe crash types. In these definitions, vehicle may refer to a car, electric device, or bicycle.
- Rear-End Crash: One vehicle hits the back of another.
- Angle Crash: One vehicle hits another at an angle, such as in a T-bone collision.
- Pedestrian Crash: A vehicle hits a person walking or using a mobility aid.
- Sideswipe – Same Direction: Two vehicles traveling the same way make side contact.
- Sideswipe – Opposite Direction: Two vehicles moving in opposite directions make side contact.
- Fixed Object in Road: A vehicle strikes an object located in the roadway, like a sign or tree.
- Fixed Object Off Road: A vehicle hits something off the road, such as a building or pole.
- Head-On Crash: Two vehicles collide front-to-front.
- Backed Into Crash: A vehicle in reverse hits another.
- Other: Rare crash types, including train collisions or animal strikes, grouped for simplicity.
How Many Car Accidents in Arlington County Annually?
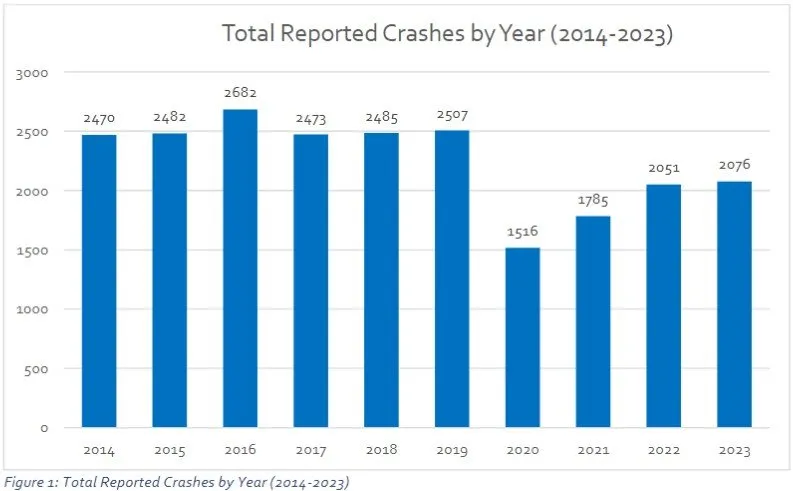
The annual average over 10 years (2014 to 2023) is approximately 2,250 crashes per year.
From 2014 to 2023, overall reported crashes in Arlington fell overall. In 2014, 2,470 crashes were reported. This total was generally flat until 2019, with totals fluctuating between 2,473 and 2,682.
In 2020, though, crashes fell dramatically to 1,516, probably due to less travel during the COVID-19 pandemic. Crash totals started increasing in subsequent years, with 1,785 in 2021, 2,051 in 2022, and 2,076 in 2023.
While the overall number of crashes in 2023 was still below the pre-pandemic years, it does mark a consistent return to those figures. This 10-year period sees a 16 percent reduction in overall crashes.
The statistics indicate that, as driving levels have generally returned, traffic safety initiatives might be having the effect of stabilizing or lowering long-term crash overall figures. Ongoing observation will be necessary to see if these patterns persist over the long term.
How Many People Are Injured in Arlington County Crashes Annually?
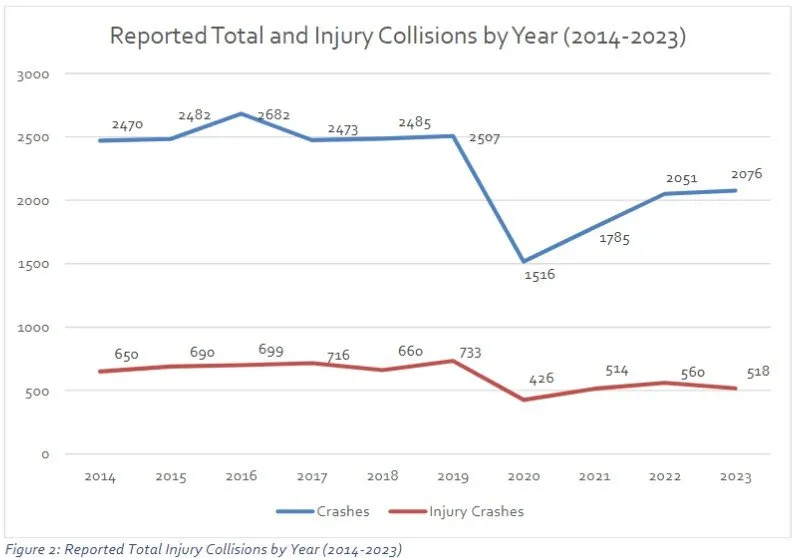
On average, there are around 600 injury crashes per year, each of which involving one or more injured people.
From 2014 to 2023, total crashes and injury crashes in Arlington tracked the same patterns. Total crashes varied from about 2,470 to 2,682 in the earlier years, and injury crashes varied from 650 to 733.
A notable decrease occurred in 2020 when total crashes fell to 1,516 and injury crashes fell as low as 426 mainly because fewer people were traveling due to the COVID-19 pandemic.
During 2021 and 2022, the crashes kept rising again, with total crashes reaching 1,785 and 2,051 and injury crashes reaching 514 and 560. Total crashes reached 2,076 in 2023 while injury crashes fell slightly to 518. This shows us a modest rebound in crash numbers without a consistent rise in injury cases.
Overall, the data shows that although crash counts have largely returned to pre-pandemic levels, injury crashes remain lower than their pre-pandemic 2014 to 2019 averages. This could be the result of improved safety measures or changing driving behaviors in the post-pandemic era.
How Many People in Arlington County Die in Car Crashes Each Year?
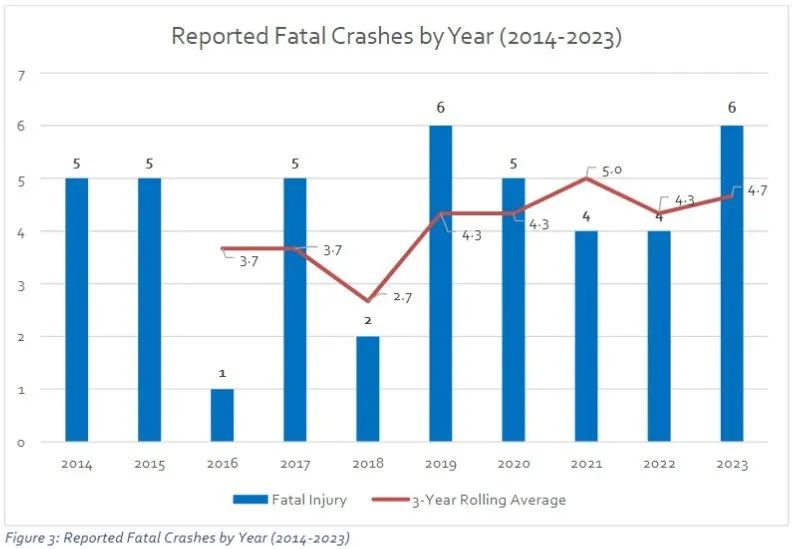
An average of three people per year die in car accidents in Arlington County.
From 2014 until 2023, Arlington’s rate of deadly accidents was low but varied to some extent. In both 2014 and 2015, five deadly accidents occurred each year. This fell to one in 2016 before rising once more to five in 2017. Two individuals were killed in 2018, and six in 2019.
Fatal accidents fell slightly in 2020 and 2021, five in 2020 and four in 2021. In 2022, four fatal accidents happened again. In 2023, the number rose slightly to six.
The 10-year trend reveals that there are four or five fatal crashes each year on average. While limited in number compared to all crashes, this steady number highlights the need for ongoing traffic safety initiatives. New data from Vision Zero within the report reveal that most fatal crashes included drinking, speeding, or nighttime driving.
Looking to Sell a Crashed Car in Virginia?

Accidents are common while driving in Arlington, especially on dangerous intersections. If your car was in an accident, the repairs might cost more than the vehicle is worth. Leaving it idle only increases the loss. This is where Virginia Car Buyers can help you out. They purchase crashed, junk, or non-running vehicles anywhere in Arlington County for cash.
It’s a simple and quick process. You receive a free quote, free pickup, and no hidden fees. You do not have to negotiate with repair shops, towing companies, or lowball private buyers. Even if your car is damaged, we’ll take it off your hands!